
Header Picture Gallery
Princeton University
Short description:
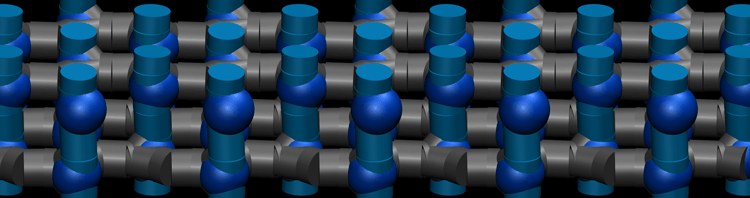
ZSM-5 pore system generated by ZEOMICS, a computational zeolite characterization tool developed at Princeton University. Sinusoidal channels (gray) intersect straight channels (blue) at cages (navy).
Long description:
Researchers at Princeton University have developed computational methods for the three-dimensional characterization of microporous networks including those found in zeolites and metal-organic frameworks (MOFs).
The approach, based on graph theory, geometry, and mathematical optimization, automatically identifies portals, channels, cages, and their connectivity. Quantities of interest are computed, such as pore size distribution, accessible volume, accessible surface area, largest cavity diameter, and pore limiting diameter. Web tools are made freely available to the scientific community:
ZEOMICS (http://helios.princeton.edu/zeomics/) for zeolites and
MOFomics (http://helios.princeton.edu/mofomics/) for MOFs.
These web tools include databases of pore characterizations for popular materials and allow users to submit additional structures. Colorful three-dimensional visualizations of the pore systems are provided. For more information,please visit our web tools or contact
Professor Christodoulos A.Floudas
Department of Chemical and Biological Engineering
Princeton University
A325 Engineering Quad
Princeton, NJ 08544, USA
floudas@titan.princeton.edu
Conditions of use:
The picture is original work generated at Princeton University. Princeton possess the rights to publicly distribute the picture and they allow the InterPore society to display it on its website. They also allow the InterPore society to use the picture in other publications and presentations with appropriate attribution.
Soslute transport with irregular source geometry in non-uniform flow simulated with new PTRW algorithm (University of Stuttgart).
Short description:
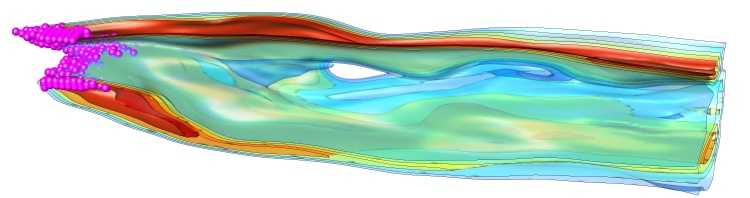
Solute transport with irregular source geometry in non-uniform flow through a heterogeneous porous medium. Pure-phase DNAPL trapped within the porous medium is indicated by pink spheres. Dissolved concentrations are visualized as iso-surfaces (blue – low concentration, red – high concentration)
Long description:
Researchers at the Institute for Modelling Hydraulic and Environmental systems have developed a new particle-tracking random walk algorithm that can account for Dirichlet and third-type boundary conditions with irregular geometries (such as DNAPL dissolution into ambient groundwater flow from a realistic space distribution of trapped DNAPL saturations).
The idea is to use PTRW as a Lagrangian technique to solve diffusive-advective transport at high Péclet numbers. However, the Dirichlet boundary condition has to be defined within a Eulerian manner, as concentrations in PTRW methods require to invoke artificial control volumes. The technique uses a Galerkin projection of PTRW simulations onto control volumes that represent the boundary condition. Publication submitted to Water Resources Research.
Contact:
Dipl.-Ing. Jonas Koch, Jun.-Prof. Wolfgang Nowak
Institute for Modelling Hydraulic and Environmental Systems
University of Stuttgart, Germany
Wolfgang.nowak@iws.uni-stuttgart.de
Conditions of use:
The picture is original work generated at the University of Stuttgart. The University of Stuttgart possesses the rights to publicly distribute the picture. The InterPore society is allowed to display it on its website. The InterPore society is also allowed to use the picture in other publications and presentations with appropriate attribution.
Bentonite grain expanding between sand grains – lms.epfl.ch/en
Description
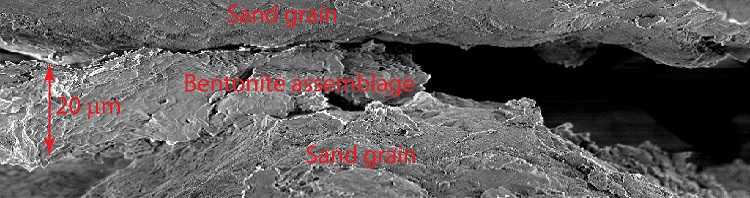
Sand/Bentonite mixtures are used in EBS for confinement of hazardous wastes. These mixtures offer good mechanical properties inherited by the sandy skeleton and reduced transport properties due to the presence of the bentonite. The picture shows a bentonite assemblage which is swelling – as a consequence of the first wetting of an engineered barrier – and occupying a large pore between two sand grains. Once swollen, the bentonite will reduce the initial water permeability of the mixture of about three orders of magnitude.
Contact
Swiss Federal Institute of Technology, EPFL
Laboratory for Soil Mechanics, LMS
EPFL-LMS, GC Station 18, CH 1015 Lausanne
Switzerland
Email: alessio.ferrari@epfl.ch
Web page : lms.epfl.ch/en
Simulated pH contours on dissolving calcite grains in domain built from XCMT experimental image (Berkeley Lab).
Short description:
A domain of calcite grains derived from X-ray computed microtomography (XCMT) (left) is used for the simulation of calcite in a crushed calcite capillary tube experiment. Simulated pH contours (right) are shown on the surface of the calcite grains indicating a range of reactive transport regimes with the pore space.
Long description:
Researchers at the Lawrence Berkeley National Laboratory have developed a new high-resolution pore-scale reactive-transport simulation capability. To validate the pore-scale model, the simulation of a flow through capillary tube experiment was performed. In the experiment, a capillary tube, approximately 0.7-cm in length and 500-µm in diameter, was packed with crushed calcite. The 3D pore structure was imaged by x-ray computed microtomography (µCT) at Berkeley Lab’s Advanced Light Source at a 0.899-µm resolution. A solution in equilibrium at a partial pressure of CO2 of 4 bar was injected in the capillary. Simulation of the experiment with the pore-scale reactive transport model utilized high performance tools and algorithms for incompressible flow, transport and multicomponent geochemical reactions using a direct numerical simulation approach. The simulation domain was constructed from the µCT image using implicit functions to represent the mineral surface locally on a grid. A Cartesian grid embedded boundary method, whereby interfacial surfaces were described by a cut-cell approach, was used to directly account for the surface area available for reaction—rather than treating reactive surface area as a continuum-scale parameter. The discrepancy between the pore-scale and the continuum-scale approach was investigated in Molins et al. (2014, Environ. Sci. Technol.)
Molins, S., Trebotich, D., Yang, L., Ajo-Franklin, J. B., Ligocki, T. J., Shen, C., and Steefel, C. I. (2014). Pore-scale controls on calcite dissolution rates from flow-through laboratory and numerical experiments. Environ. Sci. Technol. 48(13), pp 7453–7460. doi 10.1021/es5013438.
Contact:
S. Molins, D. Trebotich, C.I. Steefel
Earth Sciences Division, Lawrence Berkeley National Laboratory, Berkeley, CA, USA
SMolins@lbl.gov
3D structure and bubble size distribution in foamed cement (National Energy Technology Laboratory)

Short description:
The above image displays an atmospherically-generated cement with 10% entrained air. Gas bubbles are colored according to size, with the darkest representing the largest voids, and the white representing the smallest.
Long description:
Foamed cement is a gas-liquid dispersion that is a low-density alternative to traditional cement slurry, and is widely used in the oil and gas industry for casing wells in problematic environments, such as deepwater drilling operations. Despite wide usage, however, there is little information on the physical properties of cements at wellbore conditions.
Researchers at the National Energy Technology Laboratory (NETL) have produced the first high-resolution X-ray computed tomography 3D images of foamed cement. Cements with a range of recipes and varying air content were imaged and characterized, with a focus on quantifying bubble size distribution and analyzing cement structure. Bubble size distribution within the slurry controls the foam stability and, upon curing, the physical properties of the cement. Initial work focused on cements generated at atmospheric conditions, while current research is analyzing the mechanical characteristics as they relate to cement structure. Work is also underway to analyze pressurized foamed cements generated with field cementing equipment. Ultimately, this research aims to provide industry with the knowledge to ensure safe well operation in deepwater offshore environments.
The above image displays an atmospherically-generated cement with 10% entrained air. Gas bubbles are colored according to size, with the darkest representing the largest voids, and the white representing the smallest.
You can find our early work in the NETL technical report series:
http://www.netl.doe.gov/research/on-site-research/publications/featured-technical-reports
More publications are in the writing and planning stages.
Contact:
Barbara Kutchko
National Energy Technology Laboratory
U.S. Department of Energy
Conditions of use:
The picture is original work generated at the National Energy Technology Laboratory. NETL possess the rights to publicly distribute the picture and they allow the InterPore society to display it on its website. They also allow the InterPore society to use the picture in other publications and presentations with appropriate attribution.
Multi-scale network (UGent)
Short description:
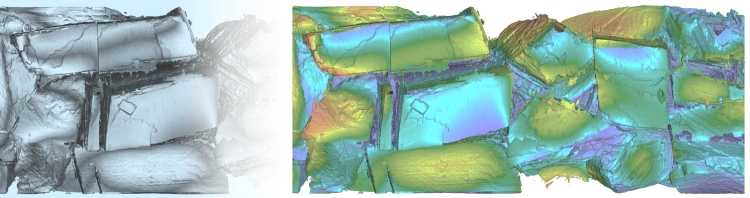
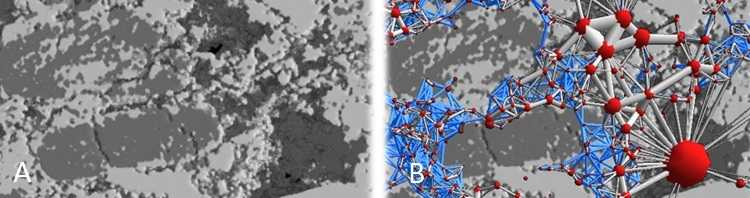
The picture on the left is a 3D rendering of a micro-CT scan of an Estaillades carbonate, with zones which contain microporosity (pore sizes < approx. 4 µm) indicated in dark grey. The picture on the right shows a multi-scale pore network model extracted directly from this micro-CT scan (the picture has been generated by Ghent University’s Centre for X-ray Tomography (UGCT) and Ghent University’s Pore-scale Processes in Geomaterials Research team).
Long description:
Certain natural rock types (e.g. carbonates and tight gas sandstones) can have a very complex multi-phase flow behavior, which bears importance to geological reservoir and aquifer management. Pore-scale modeling can play an important role to improve our understanding of this behavior, yet is complicated by the broad range of pore sizes present in these materials. The picture on the left is a 3D rendering of a micro-CT scan of an Estaillades carbonate, with zones which contain microporosity (pore sizes < approx. 4 µm) indicated in dark grey. The picture on the right shows a multi-scale pore network model extracted directly from this micro-CT scan. The model uses upscaled information to include microporosity in the simulations, while the larger pores are treated with a maximal ball pore network model. The maximal ball network is shown in figure B (red pores and white throats). The upscaled information is assigned to symbolic links, rendered in blue in B. These links connect pores which neighbour the same microporosity regions. The method allows to couple the different scales in the system without having to take into account all separate micropores explicitly, drastically reducing the computational demands.
More information can be obtained by contacting Tom Bultreys (Tom.Bultreys@UGent.be), and/or Veerle Cnudde (Veerle.Cnudde@UGent.be) or in:
Bultreys, T., Van Hoorebeke, L., Cnudde, V., 2015. Multi-scale, micro-computed tomography-based pore network models to simulate drainage in heterogeneous rocks. Adv. Water Resour. doi:10.1016/j.advwatres.2015.02.003
Contact:
Tom Bultreys & Veerle Cnudde
Centre for X-ray Tomography (UGCT)/ Pore-scale Processes in Geomaterials Research team (PProGRess)
Ghent University, Ghent, Belgium
Conditions of use:
The picture is original work generated by Ghent University’s Centre for X-ray Tomography (UGCT) and Ghent University’s Pore-scale Processes in Geomaterials Research team (PProGRess). UGCT/PProGRess possess the rights to publicly distribute the picture and they allow the InterPore society to display it on its website. They also allow the InterPore society to use the picture in other publications and presentations with appropriate attribution.